You've cracked the code on your first few winning products. Sales are climbing. Your brand is gaining traction. Now you're ready to scale aggressively, more ad spend, more inventory, more SKUs.
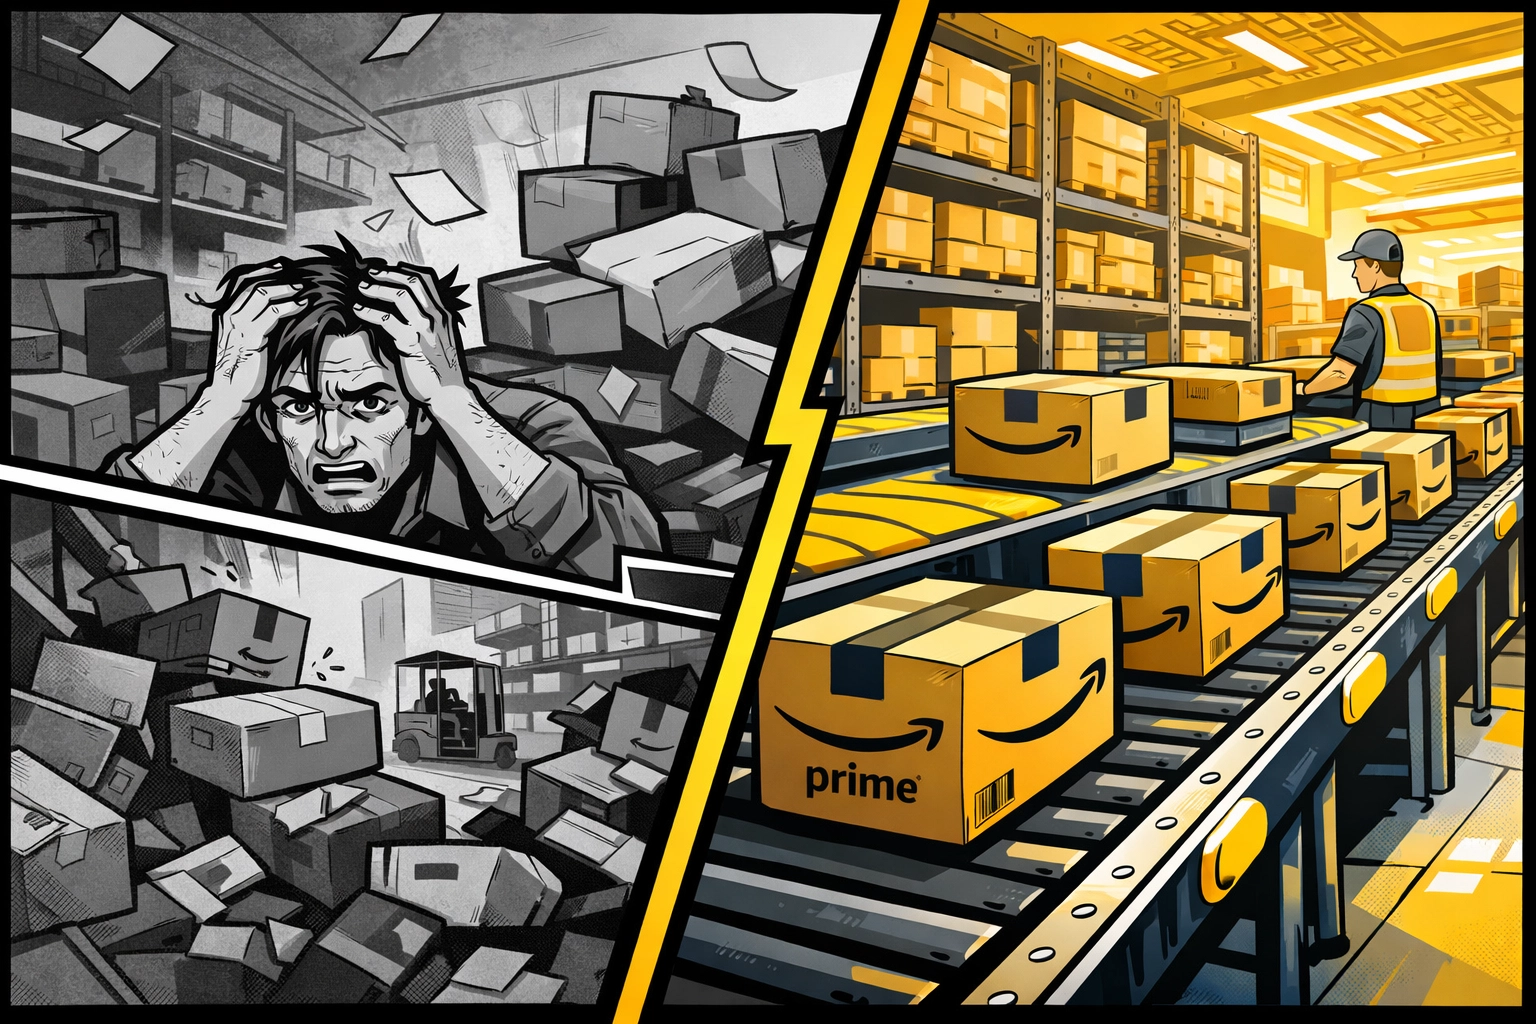
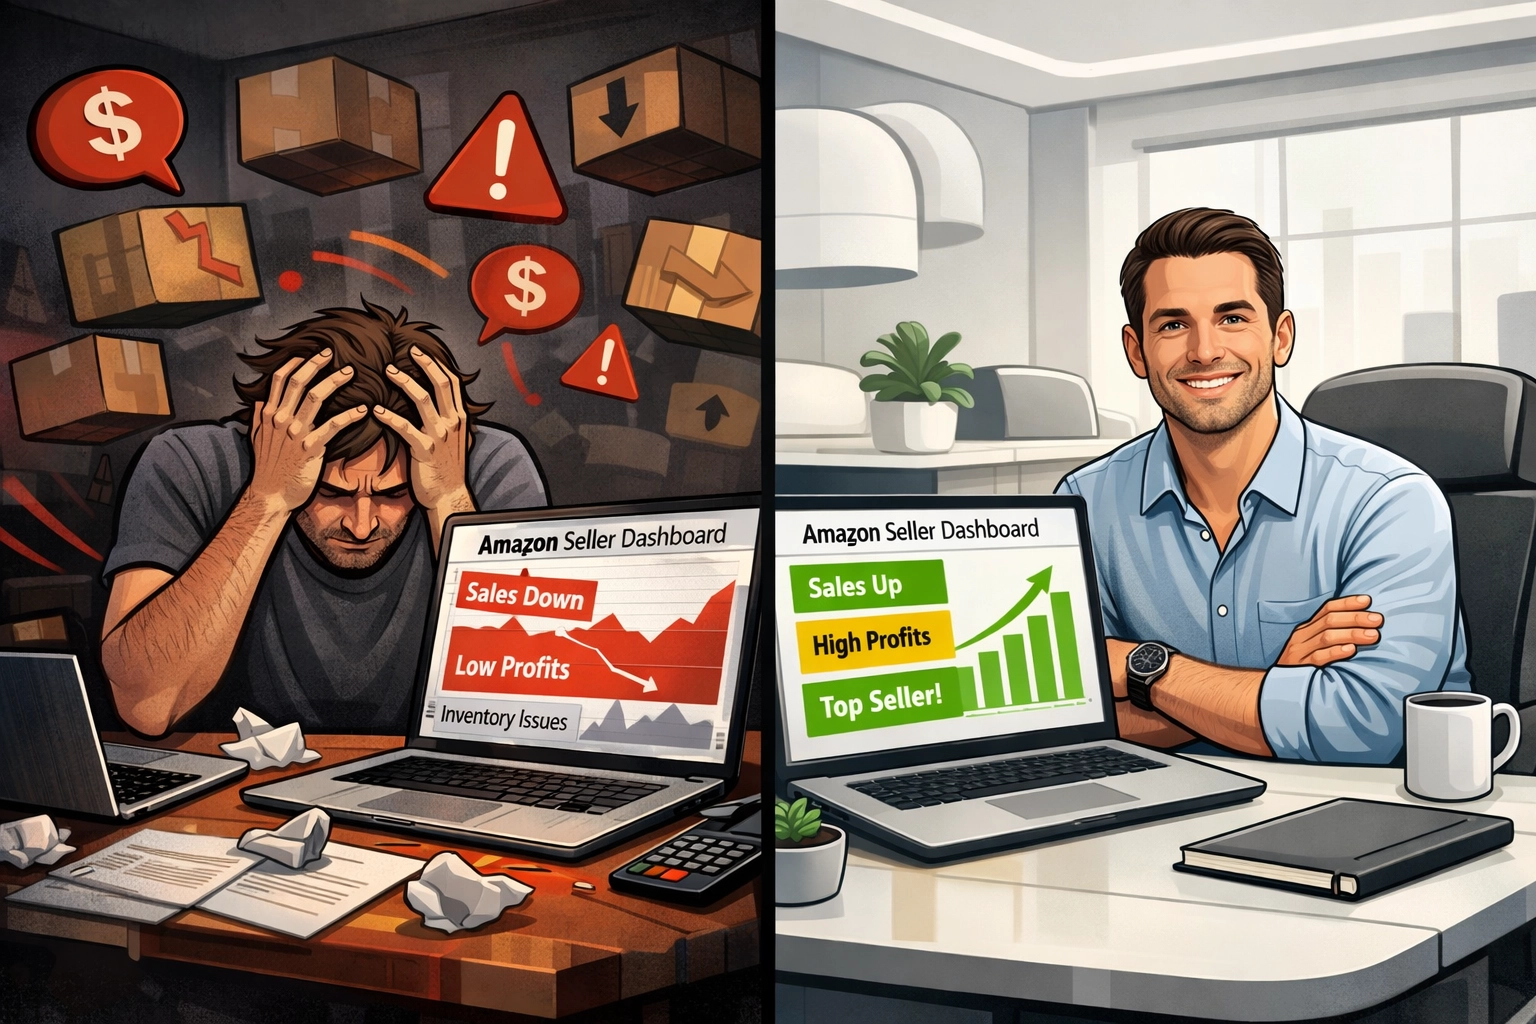
But here's what happens next for most sellers: margins collapse.
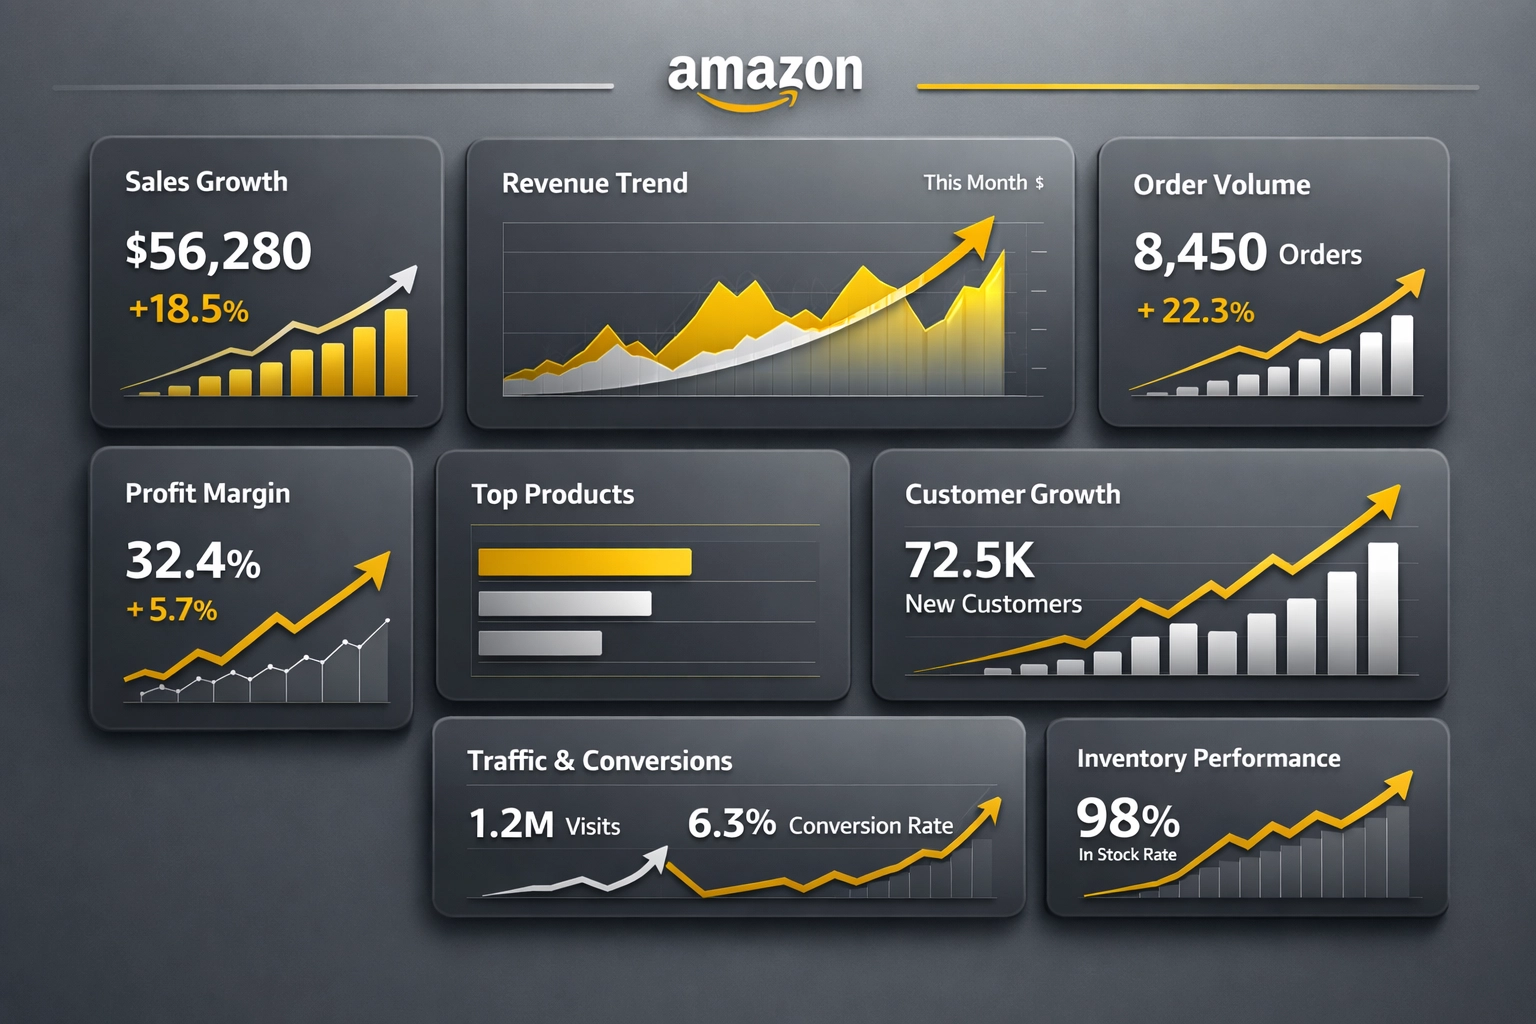
Your ACoS balloons from 18% to 35%. Inventory costs spiral out of control. FBA fees eat into profits faster than you can calculate them. Before you know it, you're doing twice the volume but making less money than when you started.
Sound familiar?
The difference between successful scaling and margin-bleeding chaos isn't luck, it's methodology. Professional Amazon agencies follow a specific framework that protects profitability during growth. In-house teams, meanwhile, often skip these crucial steps in their rush to expand.
In this post, we're breaking down the five steps that agencies use to scale without sacrificing margins, and why in-house teams consistently miss them. Let's dive in!
Step 1: Stabilize Before You Scale (The 10-Day Foundation Rule)
Here's the biggest mistake in-house teams make: trying to scale immediately.
When you see a product performing well, the instinct is to pour gas on the fire, double the ad budget, order massive inventory, launch new campaigns. But professional Amazon agencies do the opposite. They spend the first 10 days building a stable foundation across three non-negotiable areas:
The Three Pillars of Stability
1. Spend Pacing
Your daily ad budget needs to align with your inventory velocity and profit margins. Agencies analyze your burn rate, conversion windows, and replenishment cycles before increasing spend. In-house teams often just increase budgets by arbitrary percentages (20% more, 50% more) without understanding if the infrastructure can support it.
2. Campaign Structure
Are your campaigns organized for scalability? Agencies restructure campaigns into tight, segmented groups based on performance, match type, and profitability. This means separating exact match from broad, high-performers from testers, branded from non-branded. In-house teams typically run bloated campaigns mixing multiple objectives, making it impossible to scale efficiently.

3. Inventory Alignment
Scaling ad spend when you have 14 days of inventory left? That's a recipe for stockouts, suppressed rankings, and lost Buy Box. Agencies synchronize advertising velocity with inventory forecasting models that account for lead times, seasonal fluctuations, and reorder points. Most in-house teams don't have this visibility, leading to feast-or-famine cycles.
Why This Matters for Your Margins
If any of these three pillars are unstable, scaling compounds losses rather than profit. You end up paying for clicks that convert during stockouts, wasting spend on poorly structured campaigns, or burning through inventory without replenishment plans. This foundation phase isn't glamorous, but it's the difference between sustainable growth and margin erosion.
Pro Tip: Before increasing any budget by more than 20%, run a stability audit on these three areas. If you can't answer "yes" to each pillar, pause scaling and fix the foundation first.
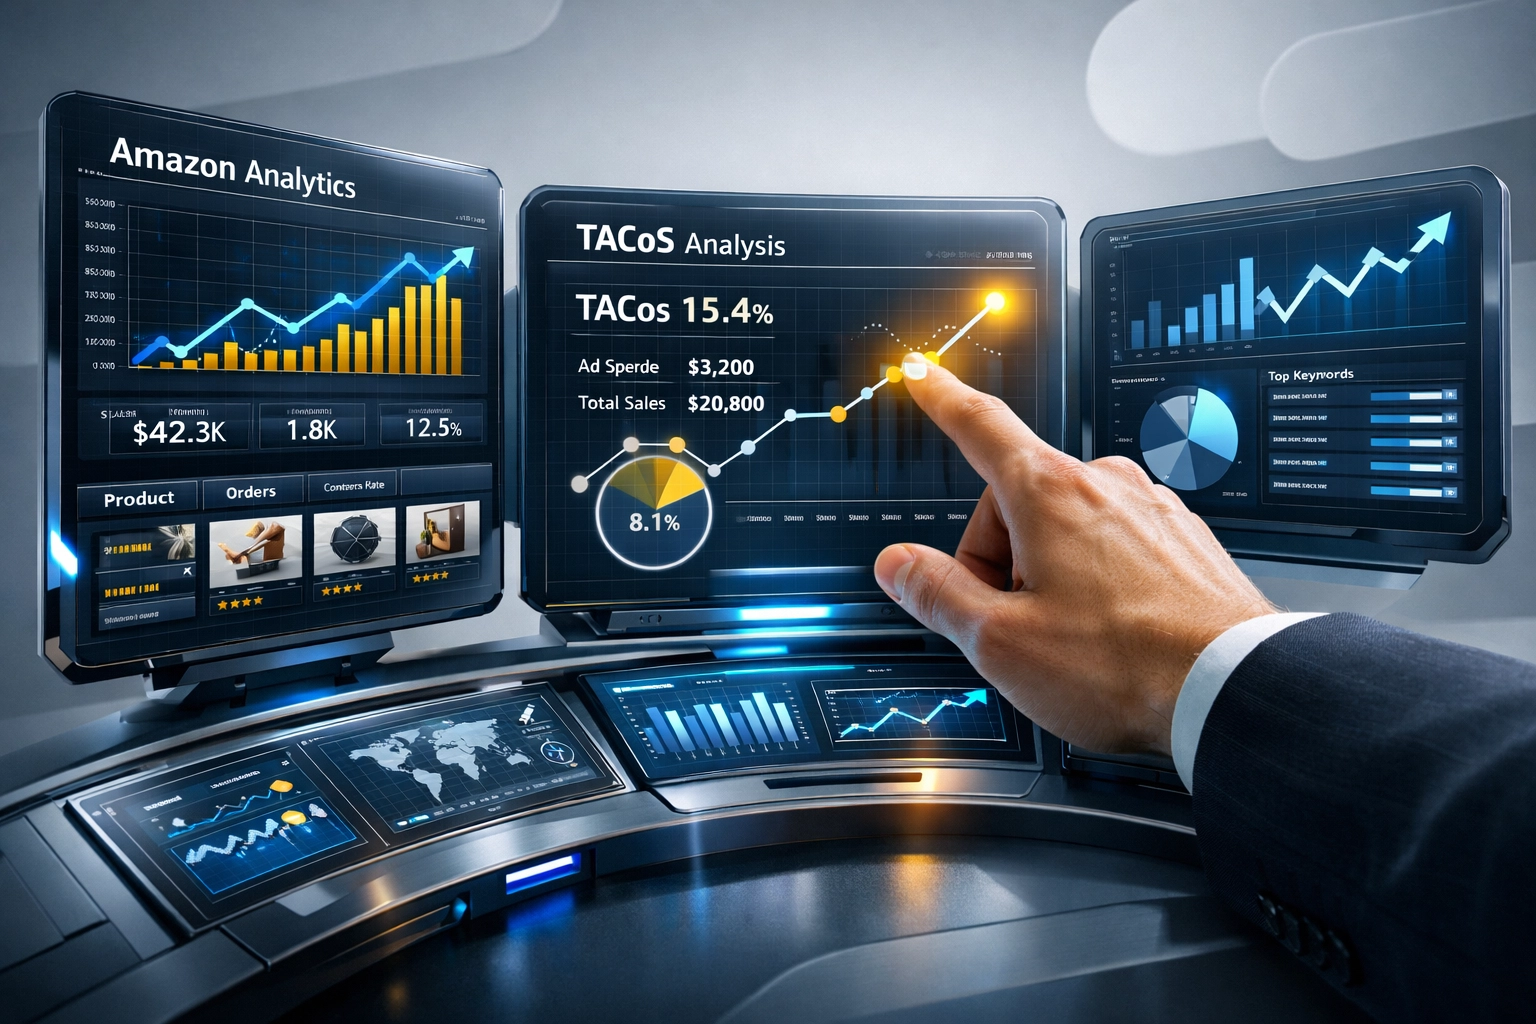
Step 2: Use TACoS (Not Just ACoS) to Identify Your True Profit Drivers
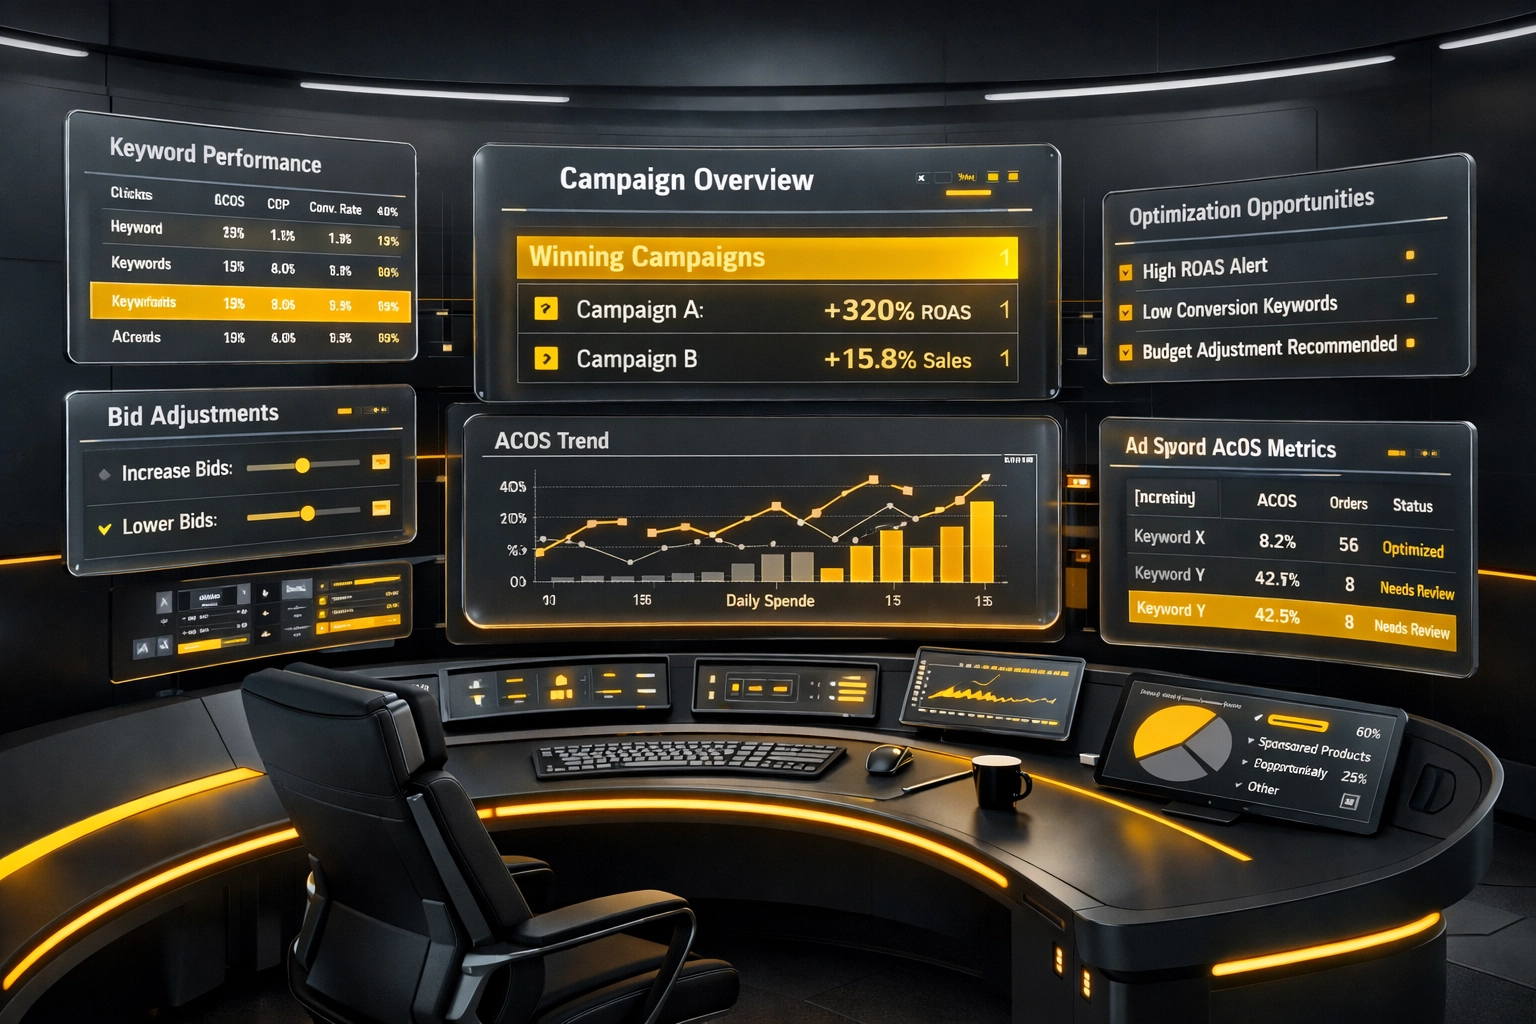
Let's talk about the single biggest metric mistake in-house teams make when scaling: obsessing over ACoS.
Don't get us wrong: ACoS matters. But when you scale based only on ACoS, you end up prioritizing products that have low advertising efficiency but terrible overall profitability. This is where TACoS (Total Advertising Cost of Sales) becomes critical.
The ACoS vs. TACoS Difference
- ACoS = Ad Spend ÷ Ad-Attributed Sales (shows advertising efficiency)
- TACoS = Ad Spend ÷ Total Sales (shows advertising efficiency relative to your entire business)
Here's why this distinction matters:
Scenario A: Product with 15% ACoS, generating $10,000 in ad sales from $1,500 ad spend. Looks great, right? But if total sales (including organic) are only $11,000, your TACoS is 13.6%: meaning you're heavily dependent on ads and margins are thin.
Scenario B: Product with 25% ACoS, generating $5,000 in ad sales from $1,250 ad spend. Seems worse. But total sales are $20,000, giving you a TACoS of just 6.25%: meaning this product drives significant organic sales and has healthier margins.
How Agencies Use TACoS to Scale Smarter
Professional amazon account management services identify true profit-driving SKUs using TACoS rather than surface-level ACoS metrics. They scale products with low TACoS (6-10%) aggressively, maintain products with moderate TACoS (10-15%), and either optimize or cut products with high TACoS (20%+).
In-house teams typically scale based on highest ad spend or lowest ACoS: which often means doubling down on products with lower overall profitability. This is a direct path to margin compression.
Action Step: Pull a TACoS report for your top 20 SKUs. Sort by TACoS ascending. You'll likely discover that your "best performers" by ACoS aren't your most profitable products by TACoS. Scale the low-TACoS winners, not the low-ACoS decoys.
Step 3: Implement Data-Driven Tools for Full Profit Visibility
Here's an uncomfortable truth: most in-house teams make scaling decisions based on incomplete data.
They know their ACoS and total sales. Maybe they track inventory levels in a spreadsheet. But they lack real-time visibility into:
- Profit margins across their entire catalog (after FBA fees, COGS, storage, and returns)
- Competitor pricing movements and how they impact margins
- Inventory forecasting that accounts for advertising velocity
- Amazon reimbursement audit opportunities that could recover thousands in lost fees
Professional Amazon agencies use enterprise-grade tools that cost thousands per month and require specialized expertise to extract actionable insights. These tools provide:
Full Profit Margin Analysis
Not just revenue: actual profit per unit after all Amazon fees, including the hidden costs that compound in 2026. Agencies can see exactly which SKUs have healthy margins at scale and which will collapse under increased volume.
Competitive Intelligence Dashboards
Real-time monitoring of competitor pricing, promotional strategies, and share of voice. When a competitor drops prices, agencies see it immediately and adjust bids or pricing to maintain margin: rather than discovering it weeks later in a sales report.
Inventory Forecasting Models
Predictive analytics that factor in advertising spend, seasonal trends, lead times, and sales velocity. This prevents the classic scaling mistake of running out of stock or over-ordering inventory that ties up cash flow.
Reimbursement Recovery Systems
Automated Amazon reimbursement audits that identify lost or damaged inventory, overcharged fees, and other errors Amazon owes you money for. In-house teams typically recover 1-2% of what's owed because they lack the tools and time to identify claims.

The Cost Gap
These tools typically cost $3,000-$8,000 per month for the software alone: not including the analyst time needed to interpret the data and make strategic decisions. Most in-house teams can't justify this expense until they're doing $3M+ annually, which means they scale blind until they reach significant size.
An experienced amazon agency amortizes these costs across dozens of clients, giving even smaller brands access to enterprise-level data infrastructure. This is why agencies can protect margins during scaling while in-house teams often can't.
Reality Check: If you're scaling without full profit visibility, you're gambling. The data gap between in-house and agency capabilities is wider in 2026 than ever before.
Step 4: Deploy Smart Automation With Human Decision-Making
Let's address the automation paradox: in-house teams either avoid automation entirely or over-automate without guardrails. Both approaches damage margins.
The Manual Scaling Trap
In-house teams managing campaigns manually can't react quickly enough to market changes. By the time they notice a competitor price drop, adjust bids for high-converting time windows, or pause underperforming keywords, they've already wasted budget. Manual management becomes a full-time job that still misses opportunities.
The Over-Automation Trap
On the flip side, teams that fully automate without proper rules and guardrails let algorithms make decisions that prioritize volume over profit. Amazon's automated bidding optimizes for conversions, not profitable conversions. Without margin guardrails, you'll hit your sales targets while destroying profitability.
How Agencies Use Smart Automation
Professional amazon advertising agencies deploy dynamic automation with human oversight. Here's what that looks like:
Dynamic Bidding with Margin Guardrails
Bids automatically scale with velocity and conversion rate: but only within pre-set margin boundaries. If a keyword's CPC rises to a point where it would push TACoS above your threshold, the system automatically reduces bids or pauses the keyword.
Day-Parting and Time-Based Optimization
Rather than running campaigns 24/7 at flat rates, agencies use automation to increase bids during high-converting windows (typically 9 AM – 9 PM on weekdays) and decrease spend during low-converting periods. This alone can improve efficiency by 15-25%.
Automated Competitive Response
When competitor pricing changes, automated rules adjust your bids, pricing, or promotional strategy within parameters you've defined. The automation handles speed; the human oversight ensures strategic alignment with margin goals.
Search Term Harvesting and Negative Keyword Management
Automated systems identify high-performing search terms from broad and phrase campaigns, promote them to exact match, and simultaneously add low-performing terms as negatives. This happens daily rather than monthly, preventing wasted spend from accumulating.

The Agency Advantage
Agencies have spent years building and refining these automation systems. They know which metrics to automate, which to monitor manually, and where the dangerous edge cases are. In-house teams building automation from scratch typically make expensive mistakes during the learning process: mistakes that directly impact margins during critical scaling phases.
Key Takeaway: Automation isn't binary. The sweet spot is strategic automation with margin-protecting guardrails and human oversight for strategic decisions. Agencies live in this sweet spot; in-house teams typically don't.
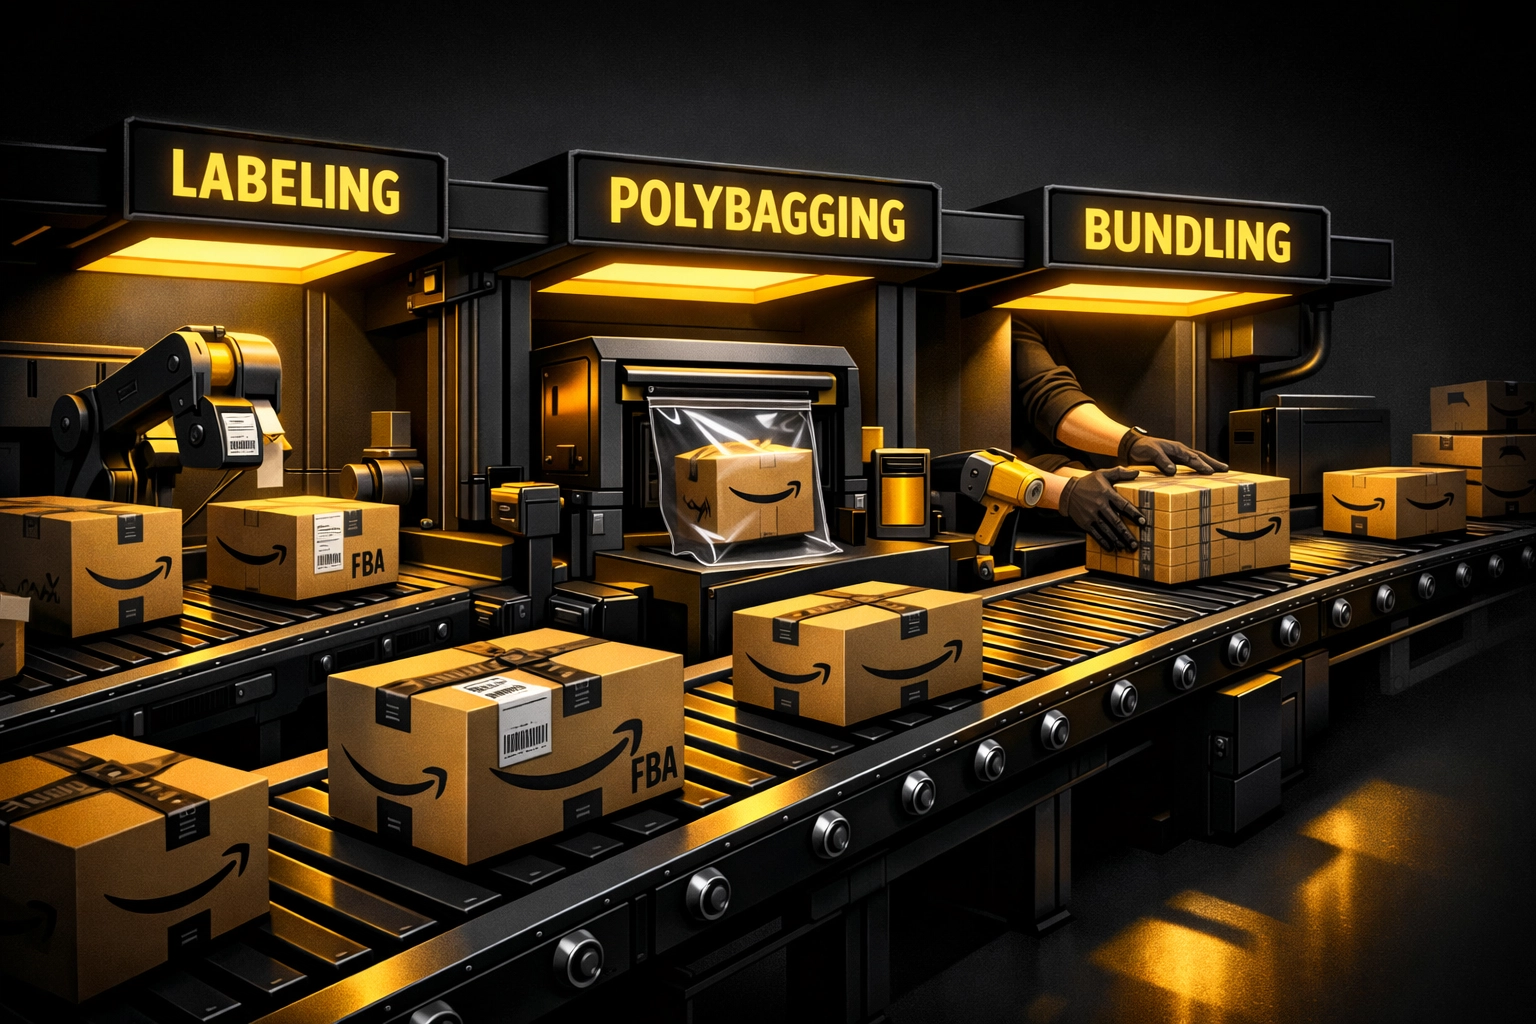
Step 5: Diversify Fulfillment to Reduce FBA Dependency
Here's a reality that's hitting hard in 2026: relying solely on FBA is a margin killer during scaling.
Amazon's fee increases, inventory limits, and the elimination of FBA prep services mean that FBA-only sellers face compounding costs that directly compress margins as they scale.
The FBA Margin Squeeze
- Storage fees increase as you scale inventory to support higher sales velocity
- Fulfillment fees now consume 20-30% of revenue for many products
- Inventory limits force you to turn inventory faster, increasing stockout risk
- Prep costs now require third-party services at higher rates
Professional agencies increasingly recommend hybrid fulfillment strategies that combine FBA with strategic alternatives:
Hybrid Fulfillment Models
FBA + FBM (Seller-Fulfilled Prime)
Use FBA for your fastest-moving SKUs and high-margin products. Fulfill slower-moving or bulkier items yourself through Seller-Fulfilled Prime to maintain Prime badge without FBA fees. Many sellers reduce total fulfillment costs by 10-20% with this approach.
FBA + Third-Party 3PL
Partner with a specialized 3PL for products that don't make sense for FBA due to size, weight, or margin constraints. This is particularly effective for bundles, multipacks, or products with heavy weight-to-value ratios.
Strategic FBM for Oversized Products
If you sell items that trigger oversized FBA fees, fulfilling them yourself (or through a 3PL) often saves $8-$15 per unit. At scale, this directly protects margins that would otherwise disappear into Amazon's fee structure.
The Agency Implementation Advantage
Setting up hybrid fulfillment isn't simple. It requires:
- SLA (Service Level Agreement) management to maintain Prime eligibility
- Inventory allocation logic across multiple channels
- Cost-per-unit calculations to determine optimal fulfillment for each SKU
- Integration with Amazon's fulfillment APIs
Most in-house teams lack the technical infrastructure and strategic experience to implement hybrid fulfillment effectively. Agencies have refined these systems across dozens of brands, making implementation faster and less risky.
Bottom Line: In-house teams focused solely on FBA lack the flexibility to respond to Amazon's tightening fee structure and inventory limits. Agencies build margin-protecting flexibility into the fulfillment strategy from day one.
The Core Difference: System Stability and Data Clarity Before Growth
Here's what ties all five steps together: agencies prioritize system stability and data clarity before volume growth. In-house teams often prioritize rapid expansion without sufficient operational infrastructure or profit visibility.
It's the difference between:
- Reactive scaling (increase spend when products perform) vs. Strategic scaling (stabilize systems, identify profit drivers, then scale with guardrails)
- Volume metrics (sales, impressions, clicks) vs. Profit metrics (TACoS, contribution margin, lifetime value)
- Manual management (spreadsheets, gut decisions) vs. Data infrastructure (enterprise tools, automated systems, real-time visibility)
This isn't about agencies being "smarter" than in-house teams. It's about infrastructure and specialization. Agencies have built systems, tools, and expertise specifically for Amazon scaling over years and hundreds of brands. In-house teams, no matter how talented, rarely have the same specialized infrastructure: especially when managing Amazon alongside a dozen other responsibilities.
Should You Build This In-House or Partner with an Agency?
If you're scaling on Amazon right now, you face a critical decision: build this infrastructure internally or leverage an agency's existing systems.
Consider this framework:
Build In-House If:
- You're doing $5M+ annually on Amazon with dedicated team members
- You can invest $10,000+ monthly in tools and talent
- You have 6-12 months to build and refine these systems
- Amazon is your core business focus (not a distribution channel among many)
Partner with an Agency If:
- You're scaling rapidly and need infrastructure immediately
- Your internal team lacks specialized Amazon expertise
- You want access to enterprise tools without upfront investment
- You need proven systems rather than learning through expensive mistakes
Many successful brands follow a hybrid path: start with an amazon brand management agency to establish infrastructure and strategic foundations, then gradually bring capabilities in-house as volume justifies the investment.
The key is avoiding the dangerous middle ground: scaling without infrastructure. That's where margins disappear fastest.
Final Thoughts: Protect Your Margins While You Grow
Scaling on Amazon without bleeding margins isn't about working harder: it's about implementing the right systems in the right sequence.
The five steps agencies use:
- Stabilize your foundation before increasing spend (10-day rule for spend pacing, campaign structure, and inventory alignment)
- Use TACoS instead of ACoS to identify your true profit-driving SKUs
- Implement enterprise-grade tools for full profit visibility and competitive intelligence
- Deploy smart automation with guardrails that protect margins while capturing opportunities
- Diversify fulfillment beyond FBA-only to reduce dependency and improve flexibility
The brands that scale successfully in 2026 aren't just growing faster: they're growing smarter, with infrastructure that protects profitability at every stage.
If you're ready to scale without sacrificing margins, Marketplace Valet has the tools, systems, and expertise to help you build that infrastructure. We've helped dozens of brands navigate this exact challenge, and we'd love to help you do the same.
What's your biggest scaling challenge right now? Reach out and let's talk about building the infrastructure your growth deserves.
Looking for more insights on protecting your margins and scaling profitably? Check out our related posts on avoiding critical scaling mistakes and Amazon's 2026 FBA fee changes.